- Автоматизация
- Антропология
- Археология
- Архитектура
- Биология
- Ботаника
- Бухгалтерия
- Военная наука
- Генетика
- География
- Геология
- Демография
- Деревообработка
- Журналистика
- Зоология
- Изобретательство
- Информатика
- Искусство
- История
- Кинематография
- Компьютеризация
- Косметика
- Кулинария
- Культура
- Лексикология
- Лингвистика
- Литература
- Логика
- Маркетинг
- Математика
- Материаловедение
- Медицина
- Менеджмент
- Металлургия
- Метрология
- Механика
- Музыка
- Науковедение
- Образование
- Охрана Труда
- Педагогика
- Полиграфия
- Политология
- Право
- Предпринимательство
- Приборостроение
- Программирование
- Производство
- Промышленность
- Психология
- Радиосвязь
- Религия
- Риторика
- Социология
- Спорт
- Стандартизация
- Статистика
- Строительство
- Технологии
- Торговля
- Транспорт
- Фармакология
- Физика
- Физиология
- Философия
- Финансы
- Химия
- Хозяйство
- Черчение
- Экология
- Экономика
- Электроника
- Электротехника
- Энергетика
4. Progress of work.
4. 1. The computer model developed by means subsystem SimEvents.
We developed the factory model in SimEvents by means of Figure 1. This model is represented in the attachment №1. Developed model has blocks for the all main process of modeling: generation of the entities (Time-Based Entity Generator), saving of the entities in the queue (FIFO Queue), entity services (Single Server), displaying information on the status of modeling (Display).
The details processed on machines are modelled by entities. Entities are generated by the Time-Based Entity Generator block. On a task, a Poisson stream of details with intensity of 20 details in an hour
The Atomic Subsystem block stops modeling at receipt more than 1000 details (Figure 2).
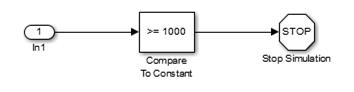
Figure 2. Internal structure of Function-Call Subsystem block.
For modeling of distribution of details on factory the Function-Call Subsystem block is used. This block generates a signal, for the OutputSwitch block, depending on a signal given to port p the entities goes either to an exit of OUT1 or to OUT2 exit. The internal structure of the Function-Call Subsystem block is presented in the figure 3, apparently from this figure this block generates the integer corresponding to number of an exit of the OutputSwitch block at the exit. And probability of the choice of an exit of OUT1 of 40%, and OUT2 of 60%. As system discrete and event, for the Function-Call Subsystem block on entrance f () it is necessary to generate the startup signal signaling about arrival of entities. This signal generates the Entity Departure Function Call Generator block.
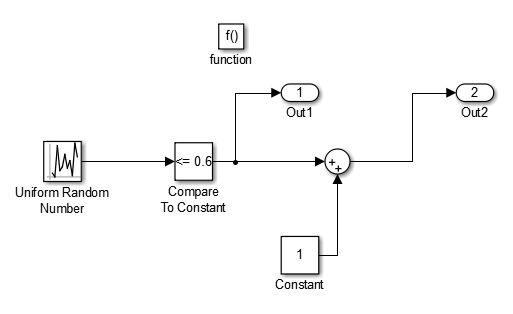
Figure 3. Internal structure of Function-Call Subsystem block.
The FIFO Queue block imitates turn before the site of the factory, the number of places when modeling isn't limited.
The machines which are carrying out processing of details are modelled by means of SingleServer blocks. Holding time is set by means of the Event-Based Random Number block. An exit of this block needs to be connected to an entrance of t of the corresponding server. Machines have an identical priority at receipt of a detail from the first site, for modeling of this condition the OutputSwitch1 block is used. In settings of this block in the field of " Switching criterion" it is necessary to choose " first port that isn't blocked". At the same time the detail will go to the machine right after its discharging. The Path Combiner1 block unites streams of details from two machines. The Path Combiner1 block unites 2 streams of details: those that just arrived from the first site and from the second. The integrated stream from 2 sites arrives to the third site on which holding time at the machine is exponential distributed on average 2 min.
Packing of the processed details is modelled by the Entity Sink block which destroys the arriving entities. For a conclusion of statistical information, the display block is connected to each block.
4. 2. Computer model developed by means subsystem StateFlow.
The Stateflow is a graphical tool for designing the complex control systems, which allows the modeling of behavior of the event driven systems based on Harel statecharts.
During the creation of the Stateflow model the following steps are usually performed:
1) creating of the model in Simulink;
2) creating of chart in Stateflow;
3) adding of the event and data interface to Stateflow block.
To create a Stateflow chart, you must first create a model in Simulink. Then it is necessary to select in the blocks library a block identifying the Stateflow chart (Chart) and to move it in to your model. After double clicking on it with the mouse, the Stateflow window will be opened (Fig. 3. 1) where with the help of menu and instrument panel you can specify the states themselves, relations between them, define variables, switching conditions and so on.
There are two groups of elements at the Stateflow chart – graphic and non-graphic. All the graphic elements are presented on the left panel of the main window – Stateflow Editor. There are " state" (state), " transition" (transition), " default transition" (default transition), " the transition to the last active state" (history junction), " alternative sign" (junction).
States. Every state describes one mode in the work of the event driven system. The state becomes active if the transition leading to this state is triggered or if the default transition is placed on this state.
Transition is an object that links together two states. A transition represents an abrupt change of the modes (states) of the system. The transition is represented at the Stateflow chart by arrow which beginning refers to source state and the ending – to destination state. The transition on the chart is set implicitly.
Default transition – a transition with given destination but without the specified source. It is used as an analogue of the initial state and in the superstates in order to determine which of the substates becomes active when the system gets to this superstate.
Connective junction – is a graphic object defining the point of brunch or connection of transitions on the chart. This object can simplify the Stateflow diagram and to generate more efficient code.
Superstates. The superstates are used to consolidate the several states having the same reaction to the event.
The superstate D on the right figure allows to simplify the transition graph presented on the left figure: the transition to the state A when event b occurs takes place regardless in which of the states B or C was the system. The right chart made with the help of superstate is equivalent to the left chart.
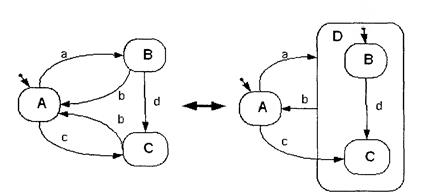
Superstate – is a state contains the other states. The state that located inside the other state called a substate. Each superstate demands that only one of the substates included in it has been marked as active. This allows to treat the transition from state A when event a occurs to superstate B as transition from state A to substate B.
The exit from the state of the highest level or superstate supposes the exit from any of the active substates of this superstate. The transitions can cross the borders of the superstate to reach the destination state. If the substate is active then his parental state (superstate) is also active.
Non-graphic elements of the Stateflow are variables, events and codes. Events, data and codes have no graphic presentation in the Stateflow editor. But you can see them in the Stateflow explorer.
Events – are the non-graphic objects in the Stateflow which control the chart. The appearance of the event changes the status of the related states and transitions.
All the events related to the Stateflow chart must be defined. There are following types of the events:
· input (Input from Simulink) – sending into the chart from the Simulink model;
· output (Output to Simulink) – sending from the chart to the Simulink model;
· local ( Local) – visible only within this chart.
The input and output events determine the links of the statechart with the Simulink model. To each such event corresponds the port on the image of the block Chart.
We developed the factory model in SateFlow by means of Figure 1. This model is represented in the attachment №2.
Each link of the factory of processing of details is presented by a superstate which has some set of substates. The modelled system is placed in the Chart block (fig. 4). The Pulse Generator block gives the clocking signal for the chart block.
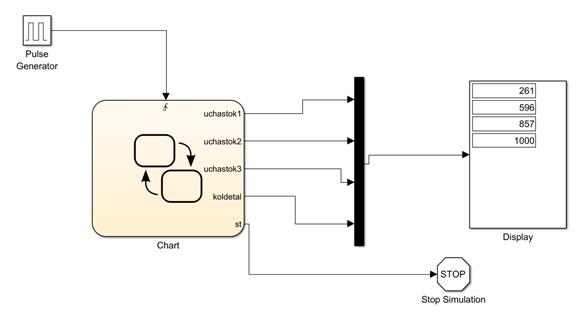
Figure 4. The modelled system by means of StateFlow.
In the chart block the following blocks are presented:
Generator/ - the block of the arriving details (fig. 5).
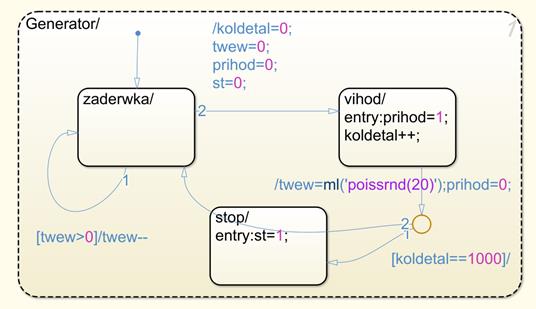
Fig. 5 The block of the arriving details.
The block has three state zaderwka/, vihod/ and stop/. At initialization of the block initial variables are set and is calculated. time of arrived of the first detail – twew. Until twew becomes equal 0, the condition of zaderwka/is active. Transition is carried out on an arrow 1 on each cycle. As soon as twew becomes equal to zero, the condition of vihod / is activated, and the flag of prihod=1 which signals about receipt of a detail will be set. The koldetal team ++ increments the koldetal variable which keeps quantity of the arrived details. At achievement of koldetal == 1000 the condition of stop/is activated and the signal of st=1 which stops modeling will work.
fifo/– this block models turn of the factory of processing of details (fig. 6)
At initialization are created the variables bocher – quantity of details in turn. On prihod flag, transition is caused in which the quantity of details in turn is incremented.
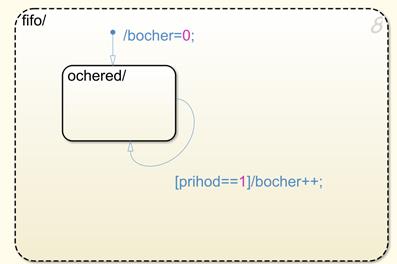
Figure 6. Model of turn of the factory of processing of details.
raspredelenie/ - model of distribution of details on sites (fig. 7).
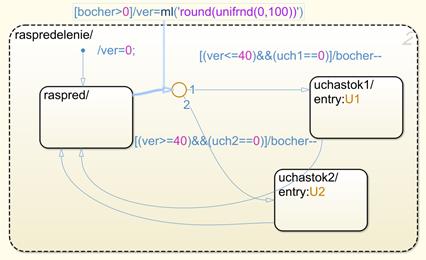
Figure 7. Model of distribution of details on sites.
At the initial moment the model is in a condition of raspred/. Then the detail (condition is checked bocher> 0 ) comes to turn of the factory, distribution conditions between sites are checked, if ver < =40, then the detail arrives on the first site if it is more – on the second site.
uchastok1/ - model of distribution of details on machines on the first site (fig. 8).
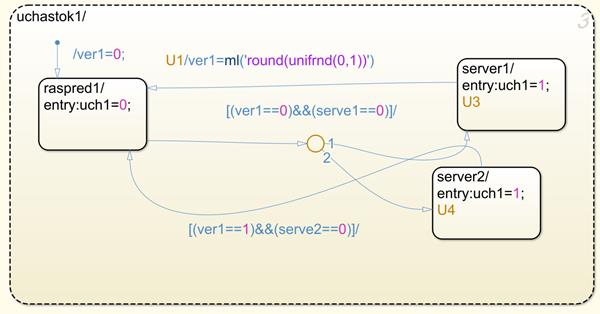
Figure 8. Model of distribution of details on the machines on sites.
At the initial moment the model is in a state raspred1/. Then the detail arrives on the site (it is checked by an event U1), distribution conditions are checked between machines as probability of distribution equal, details will arrive on machines equally.
server1/ - model of operation of the first machine on the first site (fig. 9).
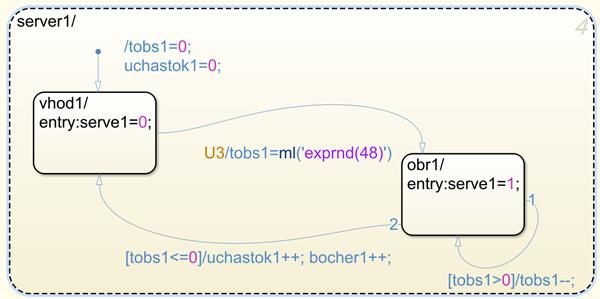
Figure 9. Model of operation of the first machine on the first site.
At the initial moment the model is in a state vhod1/. Then the detail will come to turn of the factory (it is checked by a state U3). Further transition to a state obr1 in which holding time is calculated is carried out Tobs1.
The state obr1 will be active, holding time won't end yet. After completion of service the variable uchastok1 - quantity of the details processed on the first machine increases.
server2/ - model of operation of the second machine on the first site (fig. 10).
uchastok2/ - model of operation of the third machine on the second site (fig. 11).
uchastok3/ - model of operation of the forth machine on the third site (fig. 12).
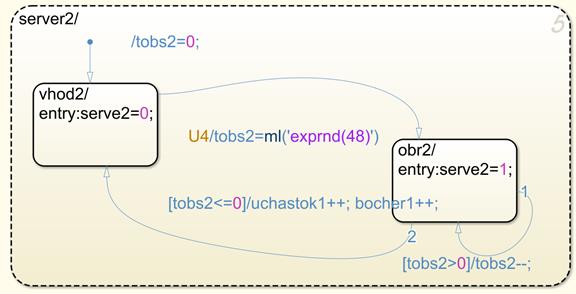
Figure 10. Model of operation of the second machine on the first site.
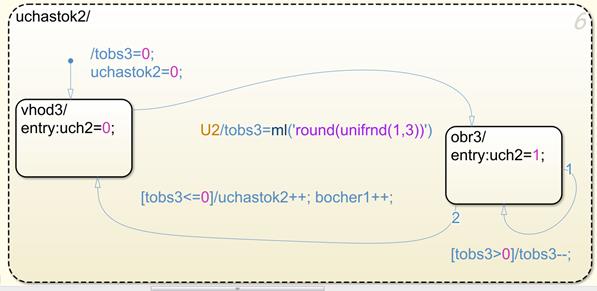
Figure 11. Model of operation of the third machine on the second site.
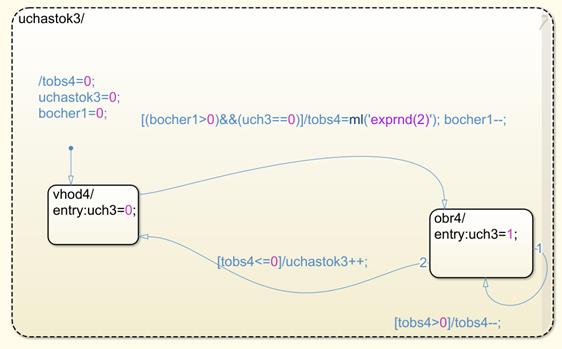
Figure 12. Model of operation of the forth machine on the third site.
Operation of the last three blocks is similar of server1/.
Description of output variables of model:
Koldetal – general quantity of arrived details.
Uchastok1 – the quantity of the details processed on the first site.
Uchastok2 – quantity of the details processed on the second site.
Uchastok3 – quantity of the details processed on the third site.
st – the signal of the stop of modeling.
|
|
|
© helpiks.su При использовании или копировании материалов прямая ссылка на сайт обязательна.
|