- Автоматизация
- Антропология
- Археология
- Архитектура
- Биология
- Ботаника
- Бухгалтерия
- Военная наука
- Генетика
- География
- Геология
- Демография
- Деревообработка
- Журналистика
- Зоология
- Изобретательство
- Информатика
- Искусство
- История
- Кинематография
- Компьютеризация
- Косметика
- Кулинария
- Культура
- Лексикология
- Лингвистика
- Литература
- Логика
- Маркетинг
- Математика
- Материаловедение
- Медицина
- Менеджмент
- Металлургия
- Метрология
- Механика
- Музыка
- Науковедение
- Образование
- Охрана Труда
- Педагогика
- Полиграфия
- Политология
- Право
- Предпринимательство
- Приборостроение
- Программирование
- Производство
- Промышленность
- Психология
- Радиосвязь
- Религия
- Риторика
- Социология
- Спорт
- Стандартизация
- Статистика
- Строительство
- Технологии
- Торговля
- Транспорт
- Фармакология
- Физика
- Физиология
- Философия
- Финансы
- Химия
- Хозяйство
- Черчение
- Экология
- Экономика
- Электроника
- Электротехника
- Энергетика
Larry Williams Percent Rate (Williams's %R)
I believe there are several things that will affect markets in 2012. The
most significant will be the decline in gold which I envision will take
place shortly after the first of the year lasting until late July. This
will add to investors confusion because that does not mean stocks will
rally. In fact I believe there is a substantial decline coming in the early
spring of 2012 based on the yield curve between three and 10 month treasury
rates. After a brief rally, for most futures at the start of the year, my
work suggests we will then turn down until mid-summer.
On a global picture the only question is will the Eurodollar die of a heart attack or self-suffocation? Certainly things in Europe are unsettled and that is not about to change as a cathartic economic processes is taking place there. This process will have impact on the American economy as well. Perhaps that is why my cyclical work is negative for gold and commodities.
But there is more than that…
The economies of China, Japan and India have also begun receding. This is best seen in imports to the West Coast.
Lawrence Dunnigan, manager of business development with the Port of Oakland recently said, " All of the imports are very soft this year. "
My friends in China are now frequently referring to a recession taking place there which is no news to anyone who has looked at the Shanghai stock index. The index has been a continual bear market for several years now. Well imports from Asia to America are down, imports from Asia to Europe are down a lot; Europe has stopped buying and given the turmoil taking place in Europe it is difficult to expect a reversal of this trend.
A quick look at commodity prices and the United States shows the last quarter of 2011 has produced a substantial decline across the board, the worst since 2008, and future prices are typically a harbinger of deflation and tough times ahead.
My suspicion is that an unsettled world wide economy will create a flight to the US dollar is coming year as investors seek protection from the European debacle and Asian meltdown.
When the president is in trouble, the market is trouble. Couple that with
the Man financial fiasco as well as the ups and downs of election year means
2012 will be volatile; with numerous large rallies and declines, no straight runway moves
1) Which trade signals do you use in your trading system for a position opening?
As far as I am concerned there are numerous ways of entering a position. If there was only one way everyone would have figured it out and this would be an easy business. Thus a trader needs a bunch of arrows in his quiver to shoot down good trades. I do use things like Trendlines, breakouts, channel breakouts, and some specific price actions that I have traded for many years.
how do you determine which signal is good and which is not?
The truth is we never know if the signal will be good or not. However, we can separate out a lot of the losers by first looking at the conditions of the marketplace. The actual entry signal is not as important as knowing if the market is conditionally set up to rally your taking a price. Most traders just look for entries and understanding you have to see the stage has been set for a rally by fundamental conditions. That is the biggest filter that I use. Conditions. If the conditions are not there for a rally why would you expect a short term signal to work?
2) Your methods of money management. The role of money management in your trading
since all traders have losses and it only takes one loss to totally wipe out your account it is important you understand how to manage your money so you do not have that black Swan experience of losing it all.
Money management is the most important thing for trading survival. I basic strategy is not to make big bets, to be willing to Losses and to do everything I can to help my average win greater than my average loss. This is not a game about accuracy percentage of trades being correct that is not an important figure. What is important is the average profit per trade, the average length of time in a trade, and the ratio of the average win the average loss. My account grows I have a larger position on each trade but is still a fixed percentage of risk of the money in my trading account.
3)what is your forecast for the main financial markets (Europe, Asia, Russia)
I addressed this in the PowerPoint presentation
4)what is your forecast for the dollar market movement in the next 2012 year? grow or decline?
I expect the United States dollar will firm up as we see a flight safety as European investors become increasingly alarmed and frightened of what is taking place there
5) what are your hobbies? : ) How do they help you in your trading?
I used to run a lot of marathons… 76 of they were great because they taught me to deal with pain as well as endurance and was not how fast he started the race how fast he finished. It also requires a great deal of discipline and put in the training work necessary to run 26. 2 miles. Even more for the longer races I ran.
6) what are the common mistakes of modern traders? how can we avoid them?
Modern traders are faced with the same common mistakes traders 100 years ago; they don't manage your money they let their emotions override their actions, they are out of emotional control. Traders fail to realize that the major problem of all startup businesses is undercapitalization. People start trading commodities with just two or $3000… They are undercapitalized.
Finally people think there is some magic formula, some equation, it will create immense wealth. There isn't. This is a business and gain it takes a great deal of energy, a lot of hard work, a little luck is primarily a very frustrating business and needs to be treated as that… A business.
http: //www. incrediblecharts. com/indicators/williams_percent_r. php
Larry Williams Percent Rate (Williams's %R)
A version of the stochastic oscillator is the Larry Williams percent rate, which is also known as Williams's %R.
In order to calculate this rate, the current close price should be subtracted from the highest high price for a specific number of days and then the result should be divided by the total range.
A reversed scale from 0 to 100% is used for plotting the Williams's %R oscillator. A result of less than 80% signals a bullish reversal. On the other hand, a result that is more than 20% indicates bearish conditions.
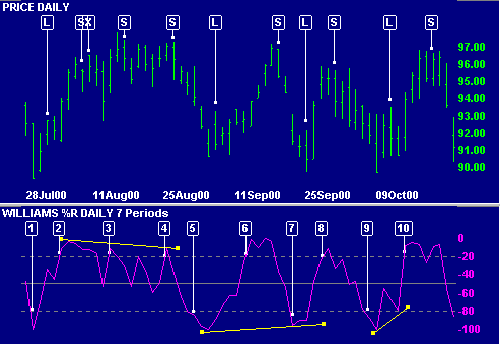
- Place a trailing buy-stop when Williams %R falls below the oversold line. We are stopped in [L] when price rises above the previous day's High. Protect your position with a stop-loss below the recent Low.
- Place a trailing sell-stop when %R rises above the overbought line. We are stopped in [S] when price falls below yesterday's Low. The position is stopped out [X] on the following day when price rises above the recent High.
- %R rises above the overbought level. Place a trailing sell-stop. A bearishdivergencesupportsthesignal.
- A triple divergence adds further support for the short position.
- Place a trailing buy-stop when %R falls below -80. When stopped in [L], place a stop-loss below the recent Low.
- Place a trailing sell-stop when %R rises above -20. When stopped in [S], place a stop-loss above the recent High.
- Place a trailing buy-stop: the oversold signal is strengthened by a bullish divergence.
- Place a trailing sell-stop.
- %R falls below the oversold level: place a trailing buy-stop. A failure swing is completed when %R rises above the level of the intervening peak.
- Another signal to go short. Place a trailing sell-stop. We are stopped in 5 days later when price falls below the previous day's Low. Protect your position with a stop-loss above the recent High.
The default setting for Williams %R is 14 periods, which can be days, weeks, months or an intraday timeframe. A 14-period %R would use the most recent close, the highest high over the last 14 periods and the lowest low over the last 14 periods.
|
|
|
© helpiks.su При использовании или копировании материалов прямая ссылка на сайт обязательна.
|