- Автоматизация
- Антропология
- Археология
- Архитектура
- Биология
- Ботаника
- Бухгалтерия
- Военная наука
- Генетика
- География
- Геология
- Демография
- Деревообработка
- Журналистика
- Зоология
- Изобретательство
- Информатика
- Искусство
- История
- Кинематография
- Компьютеризация
- Косметика
- Кулинария
- Культура
- Лексикология
- Лингвистика
- Литература
- Логика
- Маркетинг
- Математика
- Материаловедение
- Медицина
- Менеджмент
- Металлургия
- Метрология
- Механика
- Музыка
- Науковедение
- Образование
- Охрана Труда
- Педагогика
- Полиграфия
- Политология
- Право
- Предпринимательство
- Приборостроение
- Программирование
- Производство
- Промышленность
- Психология
- Радиосвязь
- Религия
- Риторика
- Социология
- Спорт
- Стандартизация
- Статистика
- Строительство
- Технологии
- Торговля
- Транспорт
- Фармакология
- Физика
- Физиология
- Философия
- Финансы
- Химия
- Хозяйство
- Черчение
- Экология
- Экономика
- Электроника
- Электротехника
- Энергетика
3. Results and discussion. Name of country. Mean specific activity(Bq kg−1)
3. Results and discussion
The sampling points are shown in Fig. 2. In a generalized form, the results of the study of the specific activity of natural and technogenic radionuclides are presented in Table 1. In the bottom sediments of the Zolotitsa river, the specific activity of 137Cs varies from 0. 8 to 15 Bq kg− 1, with an average activity in the samples of 5. 34 Bq kg− 1. The 226Ra activity varies from 2. 4 to 37 Bq kg− 1, with the average value at about 10. 07 Bq kg− 1. For 232Th, the range of changes in activity is from 5. 2 to 59 Bq kg− 1, and the average value of activity is 13. 54 Bq kg− 1. Specific 40K activity in bottom sediments of the Zolotitsa river varies from 175 to 999 Bq kg− 1, while the average activity is close to 344 Bq kg− 1.
According to the measurement results, the range of variations in the values of the specific activity of both natural radioactive isotopes and the technogenic isotope, 137Cs, differs by an insignificant scatter, while the maximum values of the activity of the studied natural radionuclides are below the Clarke values for soils and the earth's crust as a whole. This is mainly due to the fact that the hydrological and geomorphological features of the Zolotitsa river (narrow channel, relatively high flow rate, prevalence of bottom erosion), the influence of the last glaciation, and the mineral composition of the bottom sediments being predominantly of the same type and represented mainly by fine-grained well-washed sand, all produce a product of the destruction of rocks into which the river that actively cuts its channel. In this regard, active processes of sedimentation of particles dissolved that are left suspended in the water channel do not occur. This is clearly seen from the low activities of radionuclides in the sediments of the channel.
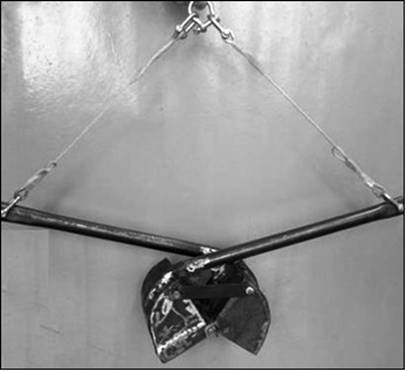
Fig. 1. External view of the sampling bucket for bottom sediments of rivers and lakes.
The results of studies of the concentration of radionuclides in the bottom sediments of the Zolotitsa River in the area of the M. V. Lomonosov diamond deposit are shown in Table 1.
Table 1. Activities of 137Cs, 232Th, 226Ra, and 40K sediment samples from the Zolotitsa River.
| Sample No | 137Cs (Bq·kg− 1) | 226Ra (Bq·kg− 1) | 232Th (Bq·kg− 1) | 40K (Bq·kg− 1) |
| ZLvd-1-18 | 2. 3 ± 0. 6 | 7. 0 ± 0. 8 | 5. 8 ± 0. 8 | 261 ± 27. 4 |
| ZLd-27-18 | 5. 2 ± 1. 0 | 7. 9 ± 0. 9 | 10. 0 ± 1. 3 | 278 ± 19. 5 |
| ZLd-26-18 | 9. 5 ± 1. 9 | 10. 0 ± 1. 2 | 11. 0 ± 1. 8 | 334 ± 30. 1 |
| ZLd-25-18 | 11. 0 ± 2. 1 | 9. 6 ± 1. 2 | 15. 6 ± 1. 9 | 294 ± 23. 5 |
| ZLd-24-18 | 15 ± 2. 3 | 29 ± 3. 5 | 37 ± 3. 3 | 471 ± 37. 7 |
| ZLd-23-18 | 14. 3 ± 2. 9 | 12. 8 ± 1. 5 | 13. 2 ± 1. 6 | 293 ± 26. 4 |
| ZLd-22-18 | 12. 6 ± 2. 5 | 7. 4 ± 1. 0 | 17. 3 ± 1. 9 | 370 ± 33. 3 |
| ZLd-21-18 | 11. 7 ± 2. 3 | 21 ± 2. 7 | 25 ± 2. 8 | 418 ± 42. 0 |
| ZLd-1-18 | 2. 5 ± 0. 6 | 4. 7 ± 0. 8 | 5. 7 ± 0. 8 | 307 ± 33. 8 |
| ZLd-2-18 | 1. 5 ± 0. 3 | 3. 0 ± 06 | 7. 8 ± 0. 9 | 219 ± 17. 3 |
| ZLd-3-18 | 2. 7 ± 0. 5 | 2. 4 ± 0. 5 | 5. 9 ± 0. 8 | 219 ± 20. 2 |
| ZLd-4-18 | 11. 4 ± 2. 3 | 15. 0 ± 1. 8 | 16 ± 2. 4 | 373 ± 32. 4 |
| ZLd-5-18 | 1. 5 ± 0. 3 | 3. 8 ± 0. 7 | 8. 0 ± 1. 1 | 221 ± 24. 3 |
| ZLd-6-18 | 2. 4 ± 0. 6 | 4. 2 ± 0. 6 | 7. 5 ± 1. 1 | 267 ± 23. 8 |
| ZLd-7-18 | 0. 8 ± 0. 3 | 12. 0 ± 1. 6 | 13 ± 1. 6 | 331 ± 36. 4 |
| ZLd-8-18 | 2. 2 ± 0. 6 | 3. 4 ± 0. 7 | 8. 4 ± 1. 1 | 218 ± 19. 7 |
| ZLd-9-18 | 2. 4 ± 0. 5 | 3. 0 ± 0. 5 | 8. 3 ± 1. 0 | 407 ± 41. 5 |
| ZLd-10-18 | 2. 2 ± 0. 4 | 9. 6 ± 1. 3 | 7. 1 ± 0. 9 | 341 ± 30. 7 |
| ZLd-11-18 | 3. 3 ± 0. 7 | 13. 0 ± 1. 4 | 15 ± 2. 1 | 409 ± 38. 9 |
| ZLd-12-18 | 5. 2 ± 1. 0 | 19. 0 ± 2. 3 | 27 ± 3. 2 | 514 ± 36. 0 |
| ZLd-13-18 | 5. 3 ± 1. 1 | 4. 8 ± 0. 8 | 8. 2 ± 0. 9 | 289 ± 28. 9 |
| ZLd-14-18 | 2. 4 ± 0. 7 | 11. 6 ± 1. 3 | 12. 1 ± 1. 2 | 428 ± 38. 5 |
| ZLd-15-18 | 7. 4 ± 1. 4 | 6. 5 ± 0. 8 | 9. 5 ± 1. 3 | 334 ± 30. 1 |
| ZLd-16-18 | 1. 9 ± 0. 7 | 3. 0 ± 0. 4 | 6. 6 ± 0. 9 | 262 ± 28. 8 |
| ZLd-17-18 | 3. 1 ± 0. 6 | 5. 8 ± 0. 6 | 5. 2 ± 0. 7 | 187 ± 20. 6 |
| ZLd-18-18 | 6. 3 ± 1. 3 | 37 ± 4. 4 | 59 ± 4. 7 | 999 ± 69. 9 |
| ZLd-19-18 | 1. 5 ± 0. 5 | 7. 9 ± 1. 1 | 8. 6 ± 1. 0 | 175 ± 15. 8 |
| ZLd-20-18 | 1. 5 ± 0. 6 | 7. 6 ± 1. 1 | 5. 5 ± 0. 8 | 232 ± 18. 6 |
| Min | 0. 8 ± 0. 3 | 1. 9 ± 0. 3 | < 1 | 175. 0 ± 15. 8 |
| Max | 18. 4 ± 3. 7 | 37. 0 ± 4. 4 | 59. 0 ± 4. 7 | 999. 0 ± 69. 9 |
| Average | 5. 4 ± 1. 1 | 9. 0 ± 1. 2 | 11. 2 ± 1. 4 | 318. 8 ± 29. 2 |
Table 2. Measured concentrations of 137Cs, 226Ra, 232Th, and 40K in sediment samples with the values reported for North Russia and various countries in the world.
|
Name of country |
Mean specific activity(Bq kg− 1) | |||
| 137Cs | 226Ra | 232Th | 40K | |
| Russia | ||||
| Delta of the Northern Dvina River (Kiselev et al., 2013) | 4. 5 | 9. 5 | 11. 3 | 328. 9 |
| Delta of the Mezen river (This work) | 5. 9 | 20. 1 | 13. 4 | 384. 0 |
| Delta of the Pechora river (Yakovlev et al., 2013) | 0. 16 | 18. 7 | 13. 3 | 373. 5 |
| White Sea (Zykov et al., 2012) | 4. 9 | 9. 8 | 21. 2 | 480. 9 |
| Barents Sea (Yakovlev et al., 2020) | 2. 9 | 13. 6 | 20. 8 | 438. 9 |
| Various countries | ||||
| Port Sudan, Sudan (Sam A. K. et al., 1998) | - | 11, 05 | 10, 36 | 325, 00 |
| Port of Patras, Greece | - | 22. 60 | 24. 50 | 497. 00 |
| Mumbai Harbor, India | - | 10, 60 | 12, 70 | 436, 00 |
| Karachi Harbor, Pakistan (Akram M., et al., 2006) | - | 23, 90 | 23, 60 | 527, 00 |
| Coast of Saudi Arabia (Al-trabulsy H. A., et al., 2011) | - | 16, 97 | 19, 00 | 641, 00 |
| Red Sea Coast, Egypt (El Mamoney M. H. et al., 2004) | - | 25, 50 | 24, 60 | 427, 50 |
| Mediterranean coast, Egypt | - | 8, 80 | 2, 10 | 46, 00 |
| Caspian Sea Coast, Iran (Reza M., et al. 2009) | - | 177, 0 | 117, 00 | 1085, 00 |
| Coast of Malaysia, South China (Mohammed C. A. R., et al., 2010) | - | 45, 90 | 73, 30 | - |
| Indian Sundarban (Surface soil) (Chaudhuri, et al., 2016) | - | 48. 70 | 58. 30 | - |
| Coastal areas of Kerala, India (Antony M. R., et al., 2019) | - | 10, 10 | 23, 16 | 241, 94 |
| Karnaphuli and Halda rivers, Bangladesh (Islam Al Amin Md Sirajul., et al., 2021) | - | 23, 74 | 37, 22 | 445, 09 |
| World average (UNSCEAR..., 2000) | - | |||

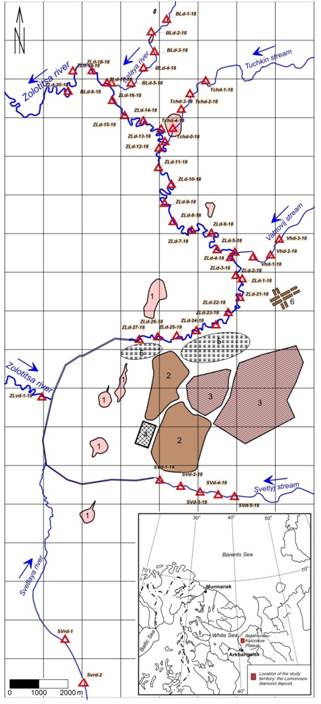
- sampling points of bottom sediments
Fig. 2. Schematic map of the sampling efforts on the Zolotitsa River in the area of the M. V. Lomonosov diamond deposit: (1) kimberlite pipes, (2) rock dumps, (3) tailing dumps, (4) mining and processing plant, (5) filtration fields, and (6) s. Pomorie.
The bottom sediments of the Zolotitsa river are mainly represented by sands of various degrees of color and granularity with a predominance of fractions of 250 and 500 µm (32% and 35%, respectively) (Fig. 3)
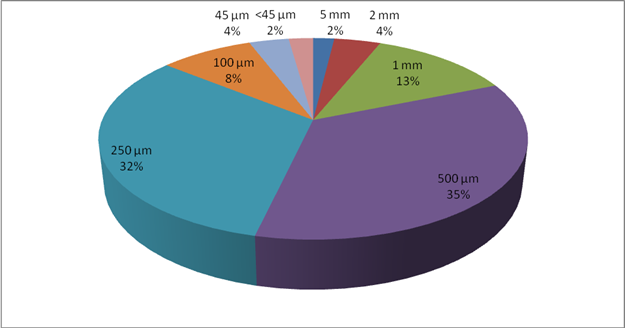
Fig. 3. Fractional composition of bottom sediments of the Zolotitsa river.

Fig. 4. Graph of changes in the activity of radioactive isotopes for 137Cs, 226Ra, 232Th, and 40K in bottom sediments of the Zolotitsa River in the direction of flow from south to north.
The bottom sediments of the Zolotitsa river are mainly represented by sands of various color and granularity with predominant fractions of 250 and 500 µm (32% and 35%, respectively) For example, in bottom sediments of lakes in the Arkhangelsk region, the average values of specific activity are significantly higher and amount to 33 Bq kg− 1 for 137Cs, 21 Bq kg− 1 for 226Ra, and 23 Bq kg− 1 for 232Th. At the same time, the 40K activity for the bottom sediments of Zolotitsa is close to the average 40K activity in the lakes of northern European, which is approximately 300 Bq kg− 1. A significant amount of 40K in the bottom sediments of the Zolotitsa River, in comparison with other radionuclides, is probably explained by the mineral composition of the channel sediments (fine-grained sands) containing the weathering products of fragments of felsic igneous rocks present in the composition of fluvioglacial sediments in this area. Nevertheless, with such relatively low activities of radionuclides in the bottom sediments of the river, some variations in the content of isotopes are still observed and have a number of regularities. Fig. 4 shows a graph that outlines the changes in the activity of 137Cs, 226Ra, 232Th, and 40K radionuclides in the bottom sediments from the south to north (from samples ZLvd-1-18 to ZLd-20-18).
Within the territory of the Lomonosov’s mining and processing plant, the Zolotitsa river was changed according to the design decisions in connection with the construction of quarries. At present, in this section, the riverbed is a technological diversion channel with slopes made of concrete slabs. In addition, drainage water is discharged into this canal from the implementation of water-reduction measures at the quarry. In this regard, the first sample of bottom sediments (ZLvd-1) was taken before the river flowed into the channel. This was done in order to obtain material upstream in the area of the natural channel that was not affected by the economic activities of the mining and processing plant. Sample ZLd-1 is characterized by lower values of 137Cs, 226Ra, 232Th, and 40K activity in comparison with the values from bottom sediments of the channel section from the northeastern boundary near the mining and processing plant territory. This area is 900 m from the mouth of the Vakhtovy stream (Fig. 4). In this section of the channel, bottom sediments are characterized by the maximum values of 137Cs, 226Ra, and 232Th relative to other investigated areas downstream. The activity of 137Cs in this area reaches 18. 4 Bq kg− 1, 226Ra is 37 Bq kg− 1, and 232Th is 59 Bq kg− 1. In the rest of the river, increased peaks in the specific activity of radionuclides in bottom sediments are distinctly confined to the mouths of the tributaries (Fig. 4). This may be due to the removal of radionuclides in the composition of finely dispersed material characterized by increased absorption properties from the catchment areas and their accumulation near the mouth parts.
In this section of the channel, the most characteristic peaks of 232Th activity are observed in the Tuchkin stream and Belaya River mouths. For the mouth of the Vakhtovy stream, the rotational peak of 232Th activity is practically not manifested. It is possible that the 232Th occurs as a result of the channels of water passing over the kimberlite pipes which enriches the bottom sediments in the Tuchkin stream and river Belaya. According to ground-based gamma spectrometry, the overlying sediment tubes are enriched in thorium relative to the background up to 17 ppm (Kiselev et al., 2017). As for the maximum specific activity of 137Cs, 226Ra, and 232Th, isotopes from the northeastern border of the mining and processing plant territory to the section of the Zolotitsa River is 900 meters from the mouth of the Vakhtovoy stream, the explanation of the observed values requires special attention.
In general, the technology for treating drainage water generated from open pits is carried out by discharging water into a swamp, the so-called filtration field, located on the northeastern border of the Lomonosov’s mining and processing plant territory. The kimberlite rocks of the deposit are characterized by a very high degree of chemical weathering, due to which almost all of the original magmatic material is represented by the high-Mg clay mineral saponite, the content of which ranges from 75% to 100%. During mining operations, the latter enters the open pit waters, forming in a finely dispersed suspension with a very low sedimentation rate (approximately 0. 004 cm/h) and the density of the resulting sediment being approximately 70% (Karpenko, 2008).
As a result, quarry water is pumped out and discharged to filtration fields also containing significant amounts of this mineral saponite. The composition of the saponite suspension supplied with the open pit waters probably also contain the isotopes, 226Ra and 232Th, since the enclosing rocks of the near-pipe space are significantly enriched in uranium and thorium (Yakovlev et al., 2020).
|
|
|
© helpiks.su При использовании или копировании материалов прямая ссылка на сайт обязательна.
|