- Автоматизация
- Антропология
- Археология
- Архитектура
- Биология
- Ботаника
- Бухгалтерия
- Военная наука
- Генетика
- География
- Геология
- Демография
- Деревообработка
- Журналистика
- Зоология
- Изобретательство
- Информатика
- Искусство
- История
- Кинематография
- Компьютеризация
- Косметика
- Кулинария
- Культура
- Лексикология
- Лингвистика
- Литература
- Логика
- Маркетинг
- Математика
- Материаловедение
- Медицина
- Менеджмент
- Металлургия
- Метрология
- Механика
- Музыка
- Науковедение
- Образование
- Охрана Труда
- Педагогика
- Полиграфия
- Политология
- Право
- Предпринимательство
- Приборостроение
- Программирование
- Производство
- Промышленность
- Психология
- Радиосвязь
- Религия
- Риторика
- Социология
- Спорт
- Стандартизация
- Статистика
- Строительство
- Технологии
- Торговля
- Транспорт
- Фармакология
- Физика
- Физиология
- Философия
- Финансы
- Химия
- Хозяйство
- Черчение
- Экология
- Экономика
- Электроника
- Электротехника
- Энергетика
May 23, 2020 Video Transcript
May 23, 2020 Video Transcript
On May 23, 2020 Larry Williams welcoming you back to Larry TV.
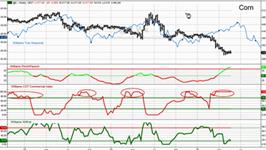
If there was ever a market setup to rally, its corn. Let me explain why. First of all you see the red line. That's the commercials (the large hedgers, the users and producers of corn) have been kind of heavy buyers. They were back here, as they were over here, as they were here, as they were over here. Always what we have seen when they become heavy buyers are rallies in the marketplace. Again we see big heavy buying by the commercials, and the market rallies. More importantly, the market is undervalued at the same time they are heavy buyers. Those rallies are a lot better, and where we are right now is we are undervalued. Our economic model forecast for corn says it is undervalued, as it was back here, as was over here. This is a nice setup tool. It is not a timing tool. A pretty good timing tool is our Pinch/Paunch indicator, which is above 60 and is starting to roll over. Now, for those who don't know this tool, it's simply an end of the trend indicator. Whenever it gets above 60 we are close to the end of the trend. Let me show you.
On a weekly chart going all the way back to 1973 we see when we get above 60 and start to roll over, we are at the end of the trend. It takes a long time for this indicator. It doesn't signal very often. But again above 60, end of the downtrend. A nice uptrend in the market, we get above 60, end of the uptrend. Another end of the uptrend. This trend move was over, and we start to move to the downside in 1981. In 1994 end of the trend indicator says we are close to the end of the trend and in fact we are. Again in 1996 the end of the big uptrend, and we were at the end of that trend. The 2004 bull market end of the trend indicator tells us we are close to the end of the trend, and indeed we are. And the end of the downtrend ended about the time that we got the indicator above 60, the end of the trend area.
And here we are right here, right now. We are above 60. We are about to roll over. That would be the change of the trend indicator. The seasonal pattern is still to the upside of this market. We have got to be looking for buys. So let's look at our daily charts.
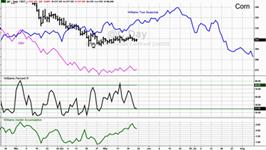
On our daily chart we see the seasonal pattern is still continuing to the upside until the end of June. We usually rally this time of the year in corn. We have been in a big trading range, back and forth, trying to break out to the upside. There's been some accumulation. There is our insider accumulation index, coming straight up during the trading range. That's positive. My Percent R is now in the buy zone. So I definitely want to continue to take buy signals in this market. Getting above Thursday's high would be an entry in this market. Have stops way back here, using a little larger stop here because of the nice set up we have in this market. I want to give it some breathing room. But continue working the long side of corn.
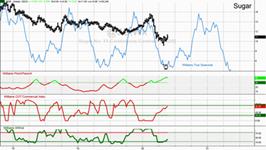
We have been bullish on sugar and still are. Again we see the seasonal pattern is nice to the upside. The Pinch/Paunch index has just gotten above 60. That's the end of the trend right at the bottom of the marketplace. We have not seen that for a long time in sugar. In terms of the commercials (the large users and producers), they have been buying this decline and are just about in the buy area. That's good enough for government work here, and we are undervalued in the market. So again, a nice setup market for a rally.
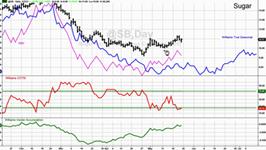
Insiders have been accumulating sugar during the big trading range it has been in. That's positive. Also, on balance volume is picking up in here. However, in the last couple of weeks the commercials have been working on the sell side of this market. Which leads me to think the big move in Sugar is going to start at the seasonal low coming around the first week of June - the middle of June. Typically (you can see the seasonal pattern) that's when the move begins. So, I think a little more back and filling in here. I wouldn't rush in and buy right away. I think we are going to see this market bounce around a little bit more as it gets oversold. Then take buy signals.
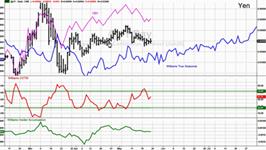
I think we just have to take buy signals in the Japanese yen. Strong seasonal pattern here. We've been following the seasonal pattern. Good accumulation in this market. While price has gone lower in here, lower here than here accumulation is higher. That's positive. We see nice accumulation in our insider index, and the commercials started buying during the middle of the week. So where do we enter? Well we have trend lines coming down here. You could be a buyer breaking out above that trend line or just getting above Friday's high on Tuesday. Remember, we will not be trading on Monday. The markets will be closed. But clearly getting a trend change to the upside in here, I think is a trend change signal we can take.
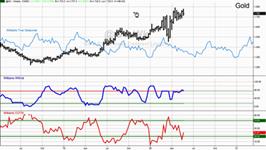
As you may have noticed this week, silver has been substantially stronger than gold. That is bearish guys and gals. When silver outpaces gold, it sets up a nice sell in all the precious metal markets. Well, we see the seasonal pattern is to the downside in here. That's a negative. In terms of our valuation model we are overvalued. I would prefer to be a buyer when we are undervalued in these zones as opposed to being in the overvalued zone. We are overvalued. If we look at our theoretical index of the commercials, we also would want to be a buyer when they are a buyer, as they were here and here and back here. Well they are in the sell zone now. I think this continues to setup a sell signal for gold. So, let's go to the daily charts.
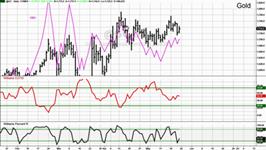
Now this gets very interesting. Look at our accumulation measure, on balance volume. While we have been making higher highs in here, not in volume. We haven't had good volume coming into this market. The last time we saw the commercials heavy buyers was back here. They were not this week. They were heavy buyers over here as you can see, the market rallied. We are not quite in the sell zones. Percent R is also in the area where we usually get rallies in this market. So what I think is going to happen is a rally back into this old high area up here, then let's take sell signals. The key point in the market is obviously Thursday's low. Taking that out means we indeed trend changed to the downside. My suspicion is a couple more days rally, then look for and take sell signals.
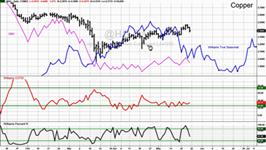
Copper I continue to think sets up a selling situation for us. The seasonal pattern is down. There's been no accumulation on this rally. Look at the accumulation line. While price has made higher highs in here, not in accumulation. Percent R recently was in the overbought area. The commercials have not been buying this market. I think what will happen is, like I said in gold, a bit of a rally in here (another one or two days rally) then look for and take sell signals. We have a nice trend line coming up here. That would be a trend change in this market as well. The formation of a lower short-term high also an entry point on the short side.
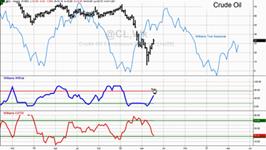
We are getting close to a sell in the energy markets. Our valuation model is not yet overvalued, as it was back here or over here. The commercials though have started to sell this market a little bit. I'd like to see a little bit more selling, see our COTSI index hang out in this area a little bit more to confirm. But we have to start thinking about this market on the downside now. The seasonal pattern suggests around the first part of July we usually go down. More importantly however, I think is a look at heating oil.
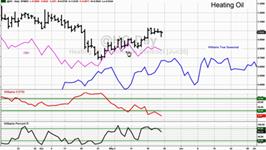
Notice the differences here, heating oil has not been as strong. New highs, but not matched by accumulation in the marketplace. Divergence. We saw the market make lower lows. We didn't see lower lows in volume accumulation. That was bullish. Well now this is bearish. The seasonal pattern is to the downside. Commercials, what have they been doing? Selling the last couple of days based on our daily analysis of commitments of traders data. We've also been overbought in this market. So, it is time to look for and take sell signals in heating oil. Where? Well clearly if we got below Friday's low that would be a very bearish sign. We also have trend lines coming up. You want to follow that during the week. There's a trend line for you. A violation of that trend line would be a trend change in this market. So let's look for and take sell signals in heating oil.
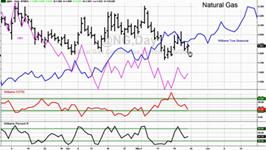
Natural gas has been the weakest of the energy markets. If we take out Friday's low, that's a sell signal. The seasonal pattern is up. Price has been much weaker than the seasonal pattern. No accumulation in here. The commercials have started to move to the sell side. If we can take out this trend line coming up here, if we take out Friday's low, sell short.
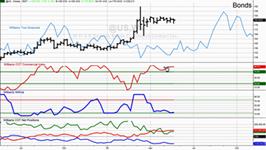
I can't believe bonds haven't started a substantial move yet. After all, the seasonal pattern is to the upside. The commercials have been buying. They are heavy buyers in an uptrend, very unusual, as they were back here before the market blasted to the upside. And, it's undervalued. If we look at the actual commitments of traders report, we see that the commercials have consistently been buying in this zone. That's so unusual for them to buy at higher prices, and exceedingly bullish. So we are going to take any breakout buy signals in the bond market.
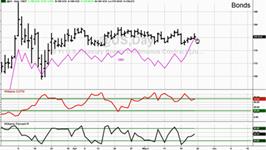
And look at volume accumulation in here. We are at new highs in volume accumulation as of Friday. We had four consecutive up closes. That's unusual, and it's a bullish pattern in the market. A bit of a dip in here, perhaps. If we were to take out Friday's high on Tuesday I think that's bullish. Look at all the accumulation by the commercials in here. We are just getting out of the oversold area. So I think we might have a bit of a dip and then as we start to move back to the upside, you got to get long this market.
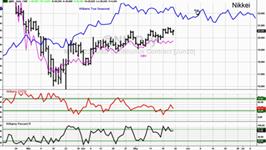
And now for our many followers in Japan, the Nikkei. What's going on there is no accumulation in this market. You can see the accumulation line. We made higher highs but not in accumulation. The seasonal pattern is to go down in here, suggesting a bit of a pull back on the market. The commercials have been selling this market. They have not been buying. They were last buyers back here. Percent R has been overbought. So it's time for a decline in this market. Where? Well we have got trend lines coming up here. Getting below Friday's low would be a signal or getting below Wednesday's low I think also would be a signal, a trend change in this market. In any event, as you'll see in a moment when we look at the S&P's, it's time to look for and take sell signals in these stock indexes.
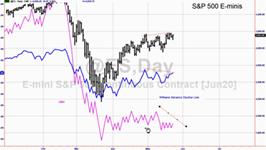
There are some real chinks in the armor of the S&P's as we can see here. The all important advance decline line (the cumulative sum of advancing and declining stocks) has not made a new high in here. It has failed three times. We made higher highs and a lot of strength. Not to have a pickup with price action, that typically is a very bearish sign in the marketplace. Especially in what could be a bear market rally. If we look at accumulation in the market as measured by on balance volume, we see about the same thing. Look at this, my gosh, there has been no volume coming in on this rally since way back here in the middle of April. That's not a good sign. However, price of course is always king in the market. So how do we handle this? Cycles are telling us we can have a quick break to the downside and then almost an immediate bounce back to the upside. I think what we need to do now is look for and take sell signals.
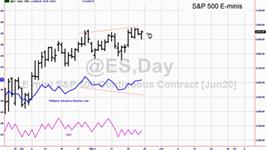
And that could be identified by getting below Thursday's low or Friday's low. We have steep trend lines coming up in here, getting below those as well. But in any event guys and gals, I'm going to look for and take sell signals in the S&P's.
Until next weekend, this is Larry Williams wishing you a very enjoyable memorial day, and we will see you in one week.
|
|
|
© helpiks.su При использовании или копировании материалов прямая ссылка на сайт обязательна.
|